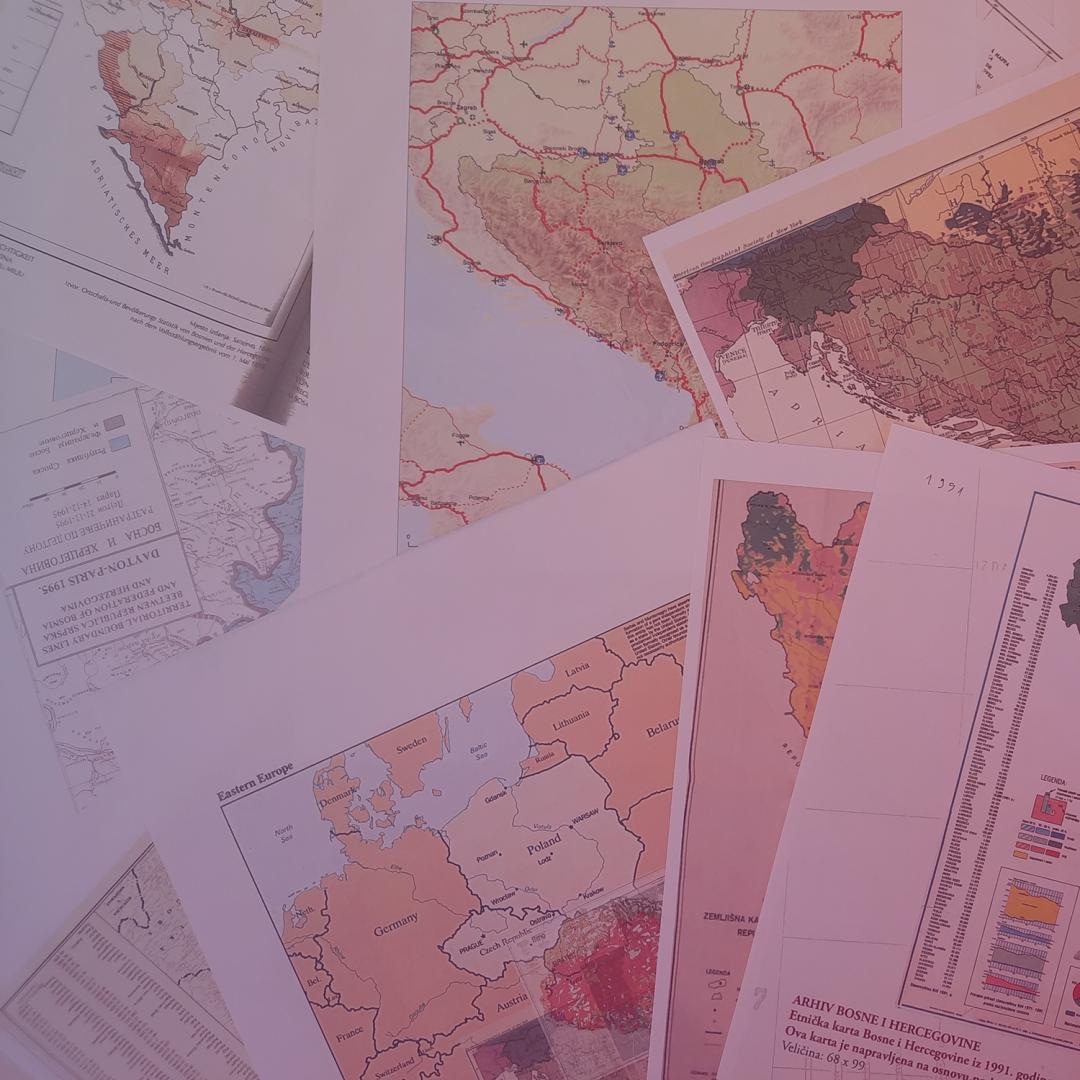
Political science with (geo)visualisations:
U N D E R D E V E L O P M E N T
This curated kit will include modules, tools and readings to complement syllabuses and teaching on conflicts in political science. It will discuss the understanding of geovisualisations, network and data visualisations in political science and provide insights into visual discourse analysis. The kit is under development. We invite you to reach out via konkoo-vislab@leibniz-ifl.de with any suggestions or ideas.
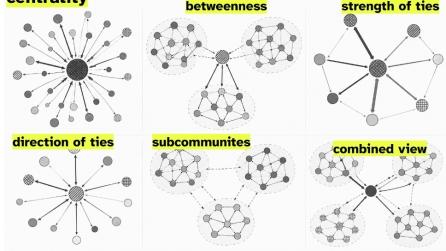
Network Visualisation: Visual Analysis of Patron-Client Relations
This module introduces the methodology of network visualisation, or visual network analysis, specifically in the context of peace/conflict research and the topic of patron-client relations. It includes reading suggestions, a short analysis guide with insights into key steps in the analysis and free tools to use, a set of presentation slides which introduce the approach and critical questions. Network visualisation, or visual network analysis, provides a way to explore patron-client relations through relationships between actors, places, institutions, infrastructures, and other entities.