How and Why Do We Do Network Visualisations?
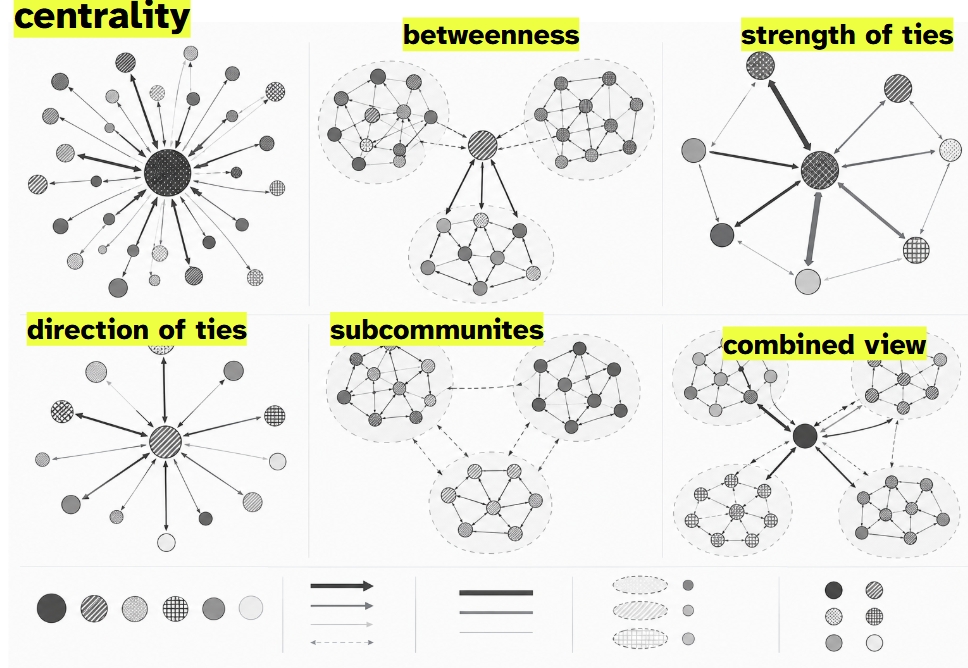
Network visualisation offers a method for investigating patron–client relations by mapping connections between political, economic, and institutional actors. Nodes can be positioned, designed, or colour-coded according to attributes such as actor type, institution, nationality, location, or relationship type. Edges are connections between them which can be represented in different ways to show the direction, type, or strength of a relationship. This makes complex relational structures and group dynamics within networks more visible to explore patterns that may be difficult to identify from data presented in tables.
This means that visualisation is not simply about producing an attractive diagram, but it actively supports analytical questions: What relationships become visible through patterns? What drives these patterns? Who or what occupies strategic positions? What remains outside the network? Network visualisation can help examine network structures, communities and subnetworks, the position and centrality of specific actors, and connections between groups perceived as separate. Measures such as degree centrality can highlight highly connected actors, while betweenness centrality can identify brokers who connect different parts of a network. Visualisation can therefore reveal how influence, resources, or information circulate, including through informal patron-client networks. Networks can also be geographical, connecting actors to places, infrastructures, events, or territories and by complementing network diagrams with maps and geovisualisations.