Teaching with Maps: Three Examples of how Maps Articulate Conflicts

This module introduces examples which illustrate how maps have shaped political imaginaries, territorial claims, and understandings of conflict across different historical contexts. It can be integrated as a set of examples within a lecture, or as material for map analysis in group work and workshops. The first of the three examples is about ethnic mapping in post-WWI peace negotiations, focusing on Hungary’s Carte Rouge and how a contemporary satirical map reveals the long-lasting legacies of such cartographic representations in political discourse. The second looks into Cold War maps and how they contributed to reconfiguring political visual culture, constructing geopolitical divisions, spheres of influence, and perceptions of threat. The third turns to contemporary digital mappings of Russia’s invasion of Ukraine, examining how different mappings construct military, humanitarian, and civilian perspectives on the war through their choices of data, visualisation, and temporal framing. 


Mapping Hungary: From Territorial Claims to Cartographic Satire

Maps played a significant role in constructing and contesting Hungarian national identity in relation to territorial changes following the First World War. One influential example is Pál Teleki’s Carte Rouge (1919), an ethnographic map produced in the context of the postwar peace negotiations. Based on the 1910 census, it represented the linguistic composition of the Kingdom of Hungary, using a striking amount and hue of red to emphasise Hungarian-speaking populations. Through its colour choices, reductive population-density representation and treatment of sparsely inhabited areas, the map visually reinforced the territorial unity of Greater Hungary. Presented as scientific evidence, it functioned as a political argument against the partitioning of Hungary at the WWI peace conference where it was also challenged for appearing as a propaganda image. Almost a century later, the Hungarian Two-Tailed Dog Party (MKKP) subverted the use of maps as nationalist territorial imaginaries through its satirical Make Hungary Smaller Again map. To ridicule political options mourning Hungary’s pre-1920 borders, the map proposes shrinking the country further to expose the political assumptions behind territorial nostalgia.

These examples demonstrate how maps can both legitimise and challenge dominant political narratives. While Carte Rouge mobilised cartographic authority to support territorial claims, the Two-Tailed Dog Party used visual satire to question the relationship between territory, national identity and collective memory.

These examples invite questions: How do maps transform historical territories into political claims? How do colours, boundaries and territorial shapes evoke national belonging? And how can humour and counter-mapping disrupt seemingly natural understandings of territory?

See also Segyevy (2019), 100 Years of Carte Rouge and The Two-Tailed Dog Party’s Make Hungary Smaller Again map.
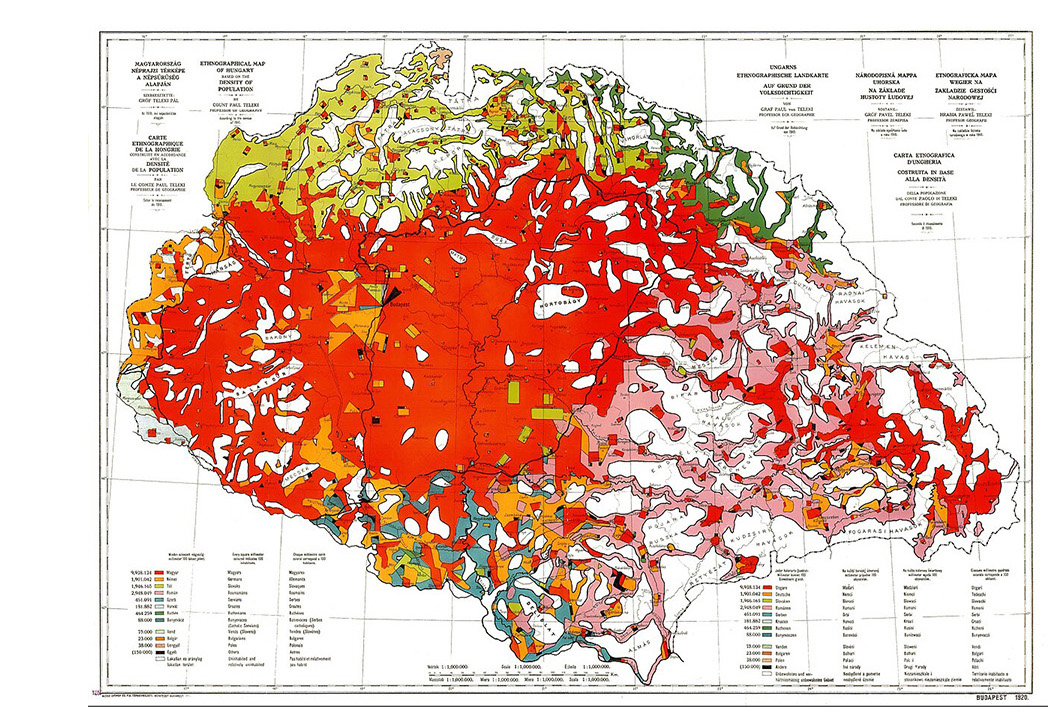
Count Teleki. 1910. Ethnographic map of Hungary /Carte Rouge (Wikimedia Commons).

Mapping the Cold War: Dividing the World into East and West

During the Cold War, maps played an important role in constructing geopolitical imaginaries of a world divided between competing ideological blocs. As Timothy Barney (2015) demonstrates, cartographic representations helped shape how American audiences understood their country's position, its allies, and its perceived enemies.

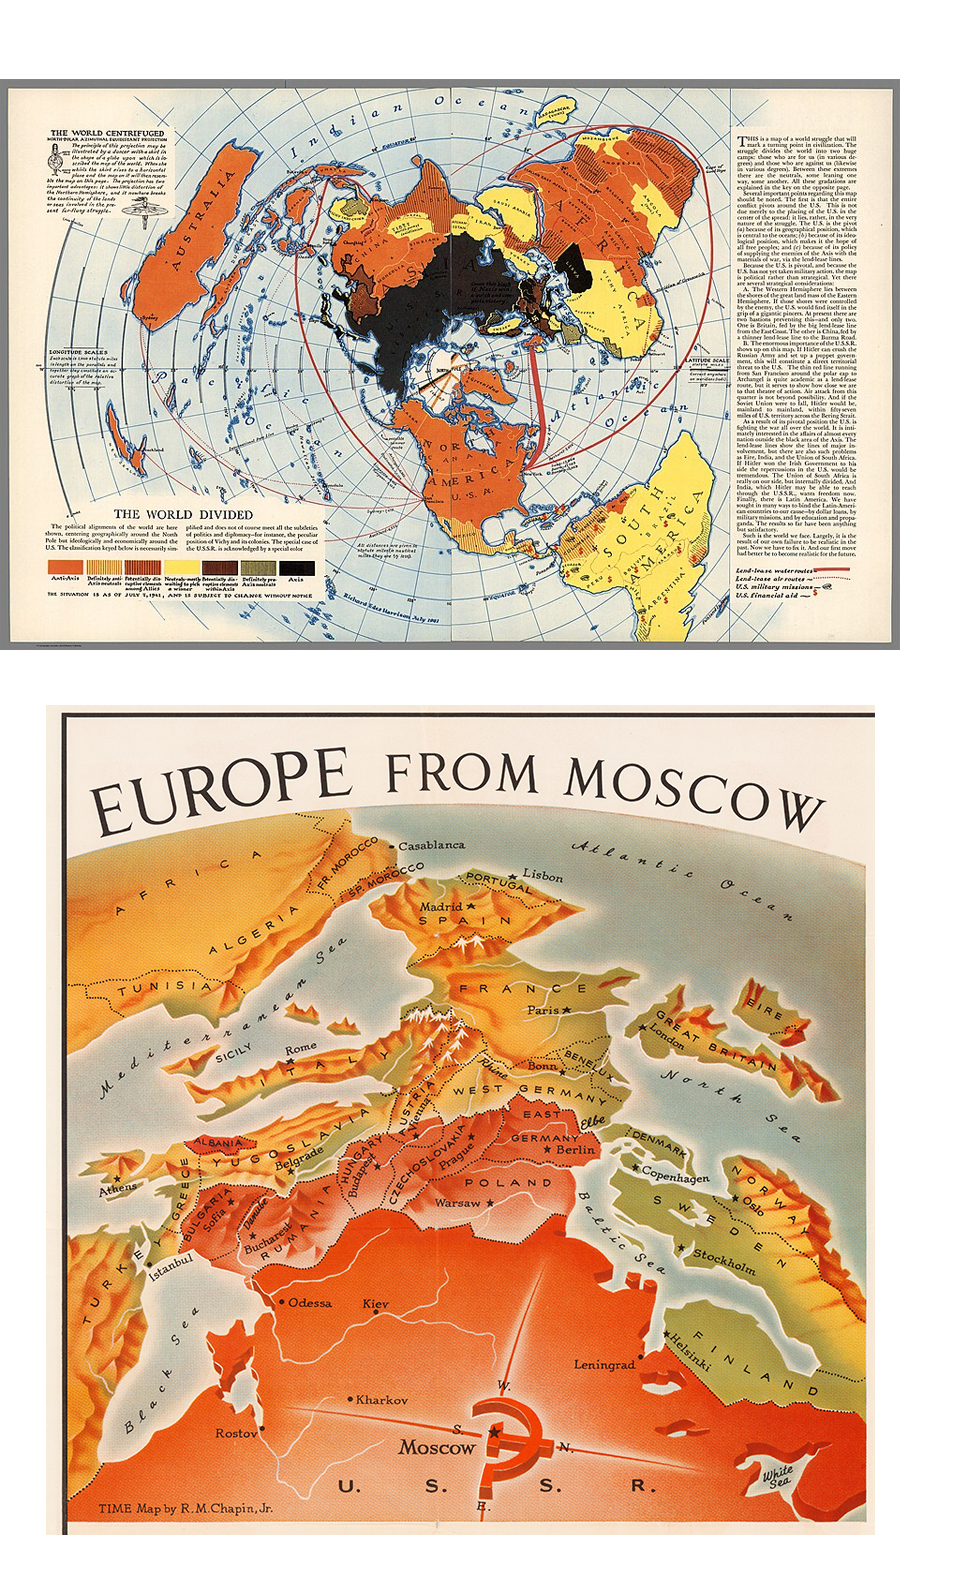
Richard Edes Harrison’s The World Divided (1941), published in Fortune magazine during the Second World War, anticipated this emerging visual geopolitics discourse. Using an unconventional polar projection, the map represented political and strategic alignments across the globe while centring the North Pole and positioning the United States as the centre of international political and economic relations. Its visual language challenged conventional world maps and helped establish new ways of representing global power and geographical proximity.

A later example, Robert M. Chapin’s Europe from Moscow (1952), published in TIME magazine, illustrates how cartographic perspective was used to communicate to large audiences about the perceived Soviet threat. Its tilted viewpoint and graduated red shading make Western Europe appear as threatened by Soviet expansion.

These examples demonstrate how maps participated in reconfiguring political visual culture, articulating geographical relationships into images of strategic proximity and territorial threat. Map projections, colours, and perspectives did not simply illustrate geopolitical relations but actively shaped how audiences would perceive and imagine them.

Looking at these maps raises questions: How do cartographic projections and viewpoints construct visions of security and threat? How do colours and visual hierarchies reinforce ideological divisions? How can maps make particular geopolitical interpretations appear as natural or inevitable?

Further reading: Timothy Barney. 2015. Mapping the Cold War: Cartography and the Framing of America's International Power (University of North Carolina Press).

Image above: The World divided, 1941. Richard Edes Harrison. Wikimedia Commons, David Rumsey Map Collection, list no 9808.000. Image below: Europe from Moscow. Wikimedia Commons - Cornell University's Persuasive Cartography collection.

Digital Maps of Russia’s Invasion of Ukraine

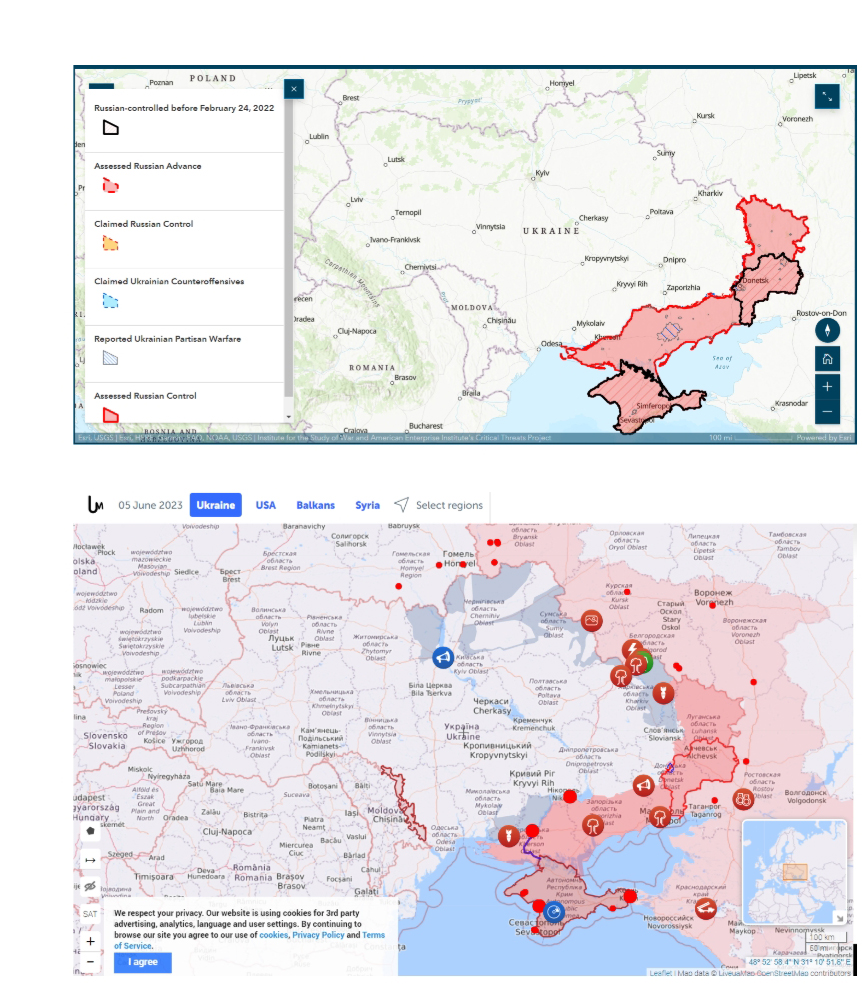
Digital maps of Russia’s invasion of Ukraine offer different perspectives on the war, depending on what they represent, how they visualise information, and whose knowledge they draw upon. The Institute for the Study of War (ISW) produces widely circulated maps focusing on territorial control and military advances. Using red and blue to distinguish Russian and Ukrainian forces, these maps reproduce conventional military cartographic representations. Their interactive timelines allow users to follow daily changes in the frontline. The focus on territorial gains and losses is a focused (but reductive) representation of the war as a sequence of military events, obscuring its broader social, political and environmental consequences.

Other platforms offer different perspectives. The ACLED Ukraine Conflict Monitor uses geolocated events, often connected to photographs, videos and social media reports.The LiveUA Map integrates a news feed alongside mapped events, making its information sources more visible and allowing users to follow developments beyond territorial changes. Meanwhile, Bellingcat offers an alternative perspective, including documentation of civilian experiences and humanitarian consequences.

Comparing these examples raises different questions: What becomes visible, and what hidden, when war is mapped through territorial control rather than civilian experiences? How do daily map updates shape our understanding of the conflict? And how does the widespread reproduction of specific maps by international media reinforce a specific perspective on the war?

Image up: Screenshot ISW Map of Russian Invasion of Ukraine (storymaps.arcgis.com/stories/36a7f6a6f5a9448496de641cf64bd375)Image down: Screenshot LiveUA map (www.liveuamap.com).